Black background with the word 'TULLY' in large white uppercase letters
Glazier Clinics logo with white text on a blue background.

More time coaching, less time chasing data.

Trusted by thousands of mission driven coaches and athletes.

Young man in casual clothing, wearing a baseball cap, standing beside a graphic promoting a football playoff game, with a dark green background.
A group of young football players and their coach celebrating on the field after a game. The players are wearing blue jerseys with white and red details, and some have black face paint. They are smiling, raising their hands, and showing expressions of joy and excitement.
A man with short dark hair, light skin, wearing a black shirt with a skull logo, tan pants, and a black belt, standing with arms crossed in front of a green background with a school emblem and a quote.
Screenshot of a Tully portal displaying a live data feed of students' workout metrics, including back squat, bench press, and bodyweight, with color-coded performance indicators, date range, and options to sort and filter the data.
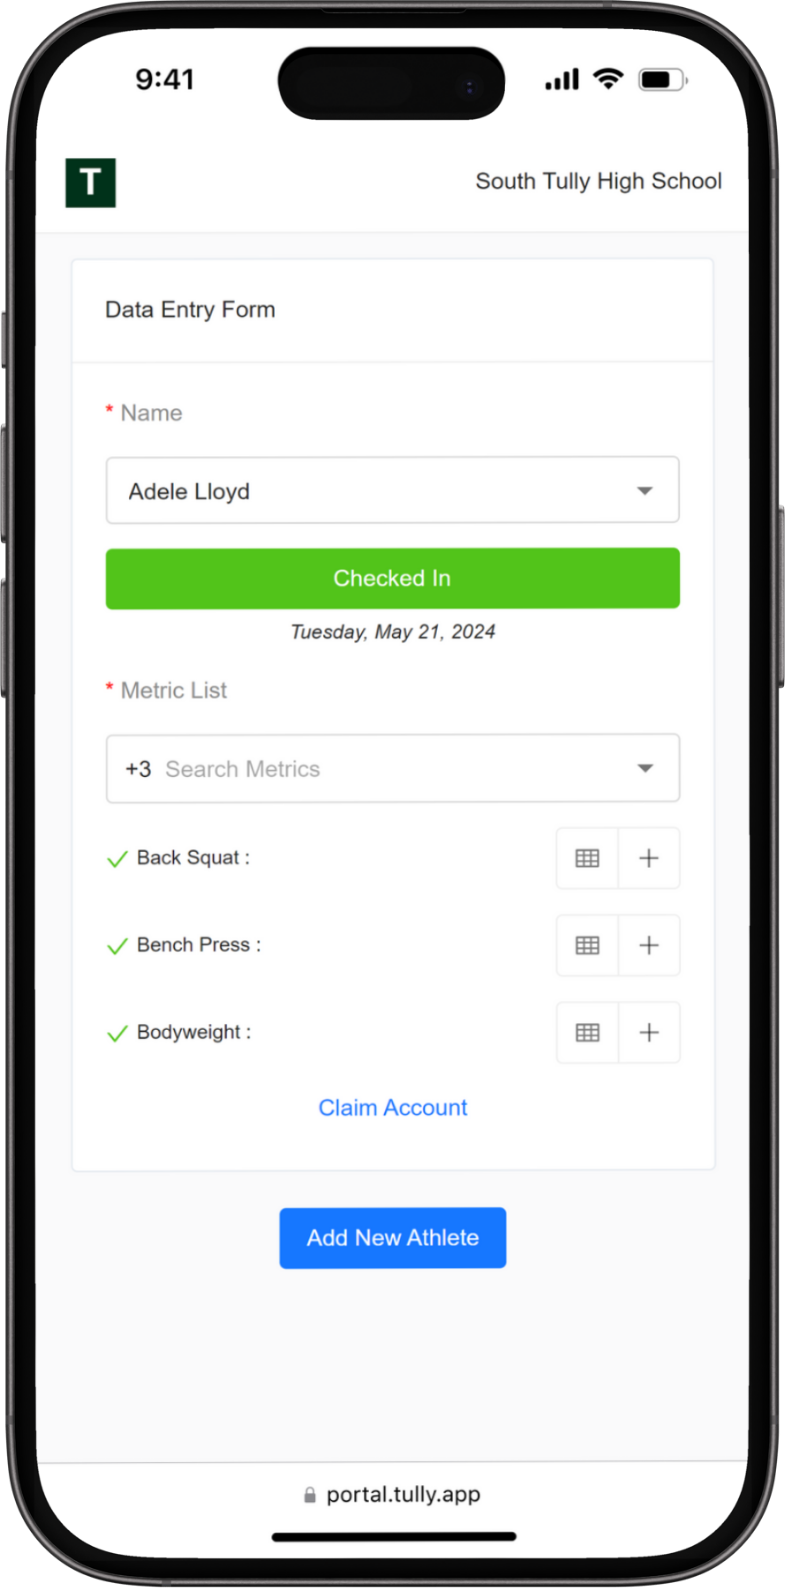
Mobile phone screen displaying a Tully portal data entry form from South Tully High School with fields for name and metric list, and options to add athletic metrics like back squat, bench press, and bodyweight.

Flexible Data Collection

Collect the metrics you care about. Most customers track athlete data such as strength, speed, and sport-specific training, but you have the flexibility to track anything.

We adjust so you don’t have to. With Tully Tracking, you can collect data during or after a training session. Athletes can submit data from any device with our patent pending QR code system, or you can restrict data collection to coaches and staff.

Instant Analysis

Get up to the second reports on attendance, improvements, current performance, personal bests, and more. Diving into athlete data is just as easily as team and organization-wide data.

Screenshot of a data report from Tully app showing attendance summary for South Tully High School, including total check-ins, average check-ins per athlete, and a list of athletes with check-in counts and teams.
Screenshot of a dashboard showing team data for South Tully High School. It includes metrics such as total data points collected, number of athletes, average improvement percentages, check-in counts, and average check-ins per athlete. The dashboard also displays individual performance metrics for activities like 40-yard dash, back squat, broad jump, and bench press.
Mobile phone screen showing an athlete summary for Jordan Baker from South Tully High School, including class year, sports, groups, Tully score, and team ranks in football.
A smartphone screen displaying fitness progress data, including a 40-yard sprint time of 4.82 seconds and a back squat weight of 382 pounds, with weekly change and a line graph showing upward trend.

Engage

Data is shared instantly with athletes giving them ownership of their athletic training.

Set it and Forget it

Spend more time coaching and less time managing data and sharing reports. Tully automatically distributes the right insights at the right time to coaches, administrators, athletes, and parents. With one click you can share results outside of your organization to easily collaborate with coaches, engage recruiters, or promote your team’s success.

There is so much more

Tully Tracking is the backbone of Tully. Tully Benchmarking and Tully Stats work seamlessly on top of Tully Tracking. We don’t have enough space here to tell you about our other features that drive engagement, communication, and performance like the Tully Score, sharing, and our notification system.

Fill out the form below to learn more.